In the article – Statistics for Data Science Part I we learned about measures of central tendency, measures of dispersion, and measures to describe shape of distribution which are confined to a single variable. So, this kind of statistical analysis involving one variable is known as Univariate Distribution.
Here in this article, we learn about data involving two variables which is called as Bivariate Distribution. For example, we may have data relating to height and weight, price and demand etc. In Bivariate Distribution we learn about relationship between the two variables under study.
Correlation is a statistical tool which studies the relationship between two variables. If change in one variable results in a corresponding change in the other variable, then the two variables are said to be corelated. For Example,
- Rise in Temperature leads to an increase in the Sales of Soft Drinks
- Decrease in Price of a commodity increases its Demand
Correlation analysis helps us in determining the degrees of relationship between two or more variables (quantitative measure). However, it does not tell us anything about cause and effect relationship.
Types of Correlation
- Positive and Negative Correlation
- Positive Correlation: When two variables move in the same direction
- Example: Relationship between height and weight, income and expenditure etc.
- Negative Correlation: When two variables move in opposite directions
- Example: Relationship between price and demand, temperature and sale of soft drinks.
- Positive Correlation: When two variables move in the same direction
- Linear and Non-Linear Correlation
- Linear Correlation: When change in one variable tends to bear a constant ratio to the amount of change in other variable.
- Non-Linear Correlation (Curvilinear) : When change in one variable does not bear a constant ratio on the amount of change in other related variable.
- Simple, Multiple and Partial Correlation
- Simple Correlation: When only two variables are studied.
- Multiple Correlation: When relationship among three or more than three variables is studied.
- Partial Correlation: When relationship between two variables is examined keeping other variables as constant.
Degrees of Correlation
- Perfect Correlation
- If the relationship between the two variables is such that the values of the two variables change in the same proportion (increase or decrease), correlation between them is said to be perfect.
- If the proportionate change in the values of two variables is in the same direction, it is called perfect positive correlation (+1)
- If the proportionate change in the values of two variables in the reverse direction, then the relation ship is know as perfect negative correlation (-1)
- If the relationship between the two variables is such that the values of the two variables change in the same proportion (increase or decrease), correlation between them is said to be perfect.
- Zero Correlation
- When there is no relationship between the two variables, we say that there is zero correlation.
- Limited Degree of Correlation
- The Value of correlation coefficient (r) normally lies in between +1 and -1
- If the changes in two variables are unequal and in the same direction, correlation is limited and positive.
- When there is an unequal changes in the reverse direction the correlation is limited negative.
Methods of Measurements of Correlation
- Scatter Diagram
- Karl Pearson’s Coefficient of Correlation (Product Moment Correlation/Simple Correlation Coefficient)
- Spearman’s Rank Correlation Coefficient
Karl Pearson’s Method Vs Spearman’s Rank Method
- Karl Pearson’s method of Correlation measures correlation for Quantitative Data, whereas Spearman’s method of Rank Correlation measures coefficient of correlation for Qualitative Data
- Karl Pearson’s method of Correlation gives more importance to extreme values as it is based on the actual values. Whereas, Spearman’s method of Rank Correlation gives less importance to the extreme values because it gives them rank.
- Karl Pearson’s method calculates deviations from Actual or Assumed Mean, where Spearman’s method calculates the rank differences.
Covariance
- Covariance is a measure of how much the two random variables vary together.
- The difference between Covariance and Variance is, variance tells us how a single variable varies whereas covariance tells us how two variables vary together.
import numpy as np
from numpy import cov
import scipy.stats
x = np.arange(1,10)
y = np.array([8,3,9,2,6,1,7,4,34])
covariance = cov(x,y)
print(covariance)

Output:
[[  7.5         12.75      ]
 [ 12.75       100.94444444]]
Correlation using Pandas
The corr() method calculates the relationship between each column in the data set.
import pandas as pd
df = pd.read_csv("employee.csv")
print(df)
df.corr()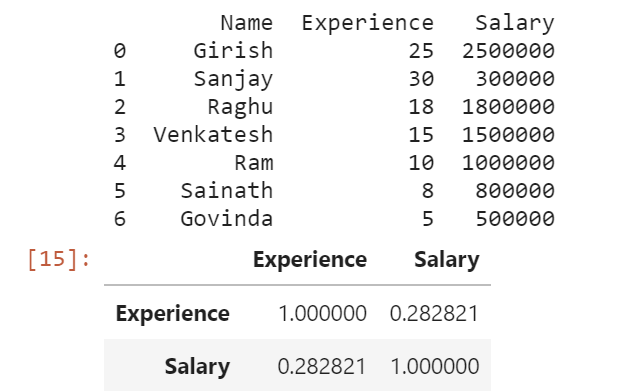
Scatter Plot
import matplotlib.pyplot as plt
import pandas as pd
df = pd.read_csv("employee.csv")
df.plot(kind = 'scatter', x = 'Experience', y = 'Salary')
plt.show()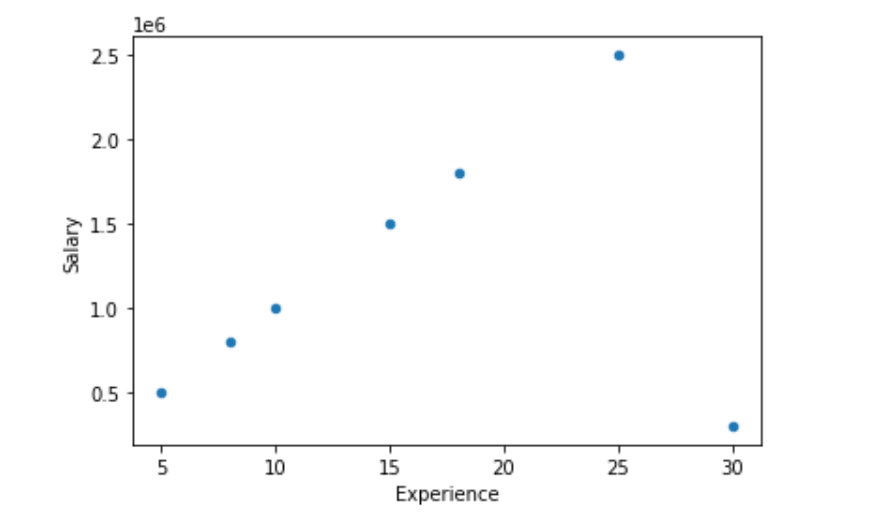
Correlation using Seaborn Heatmap
import matplotlib.pyplot as plt
import pandas as pd
import seaborn as sns

df = pd.read_csv("employee.csv")

# plotting correlation heatmap
dataplot = sns.heatmap(df.corr(), cmap="icefire", annot=True)

# displaying heatmap
plt.show()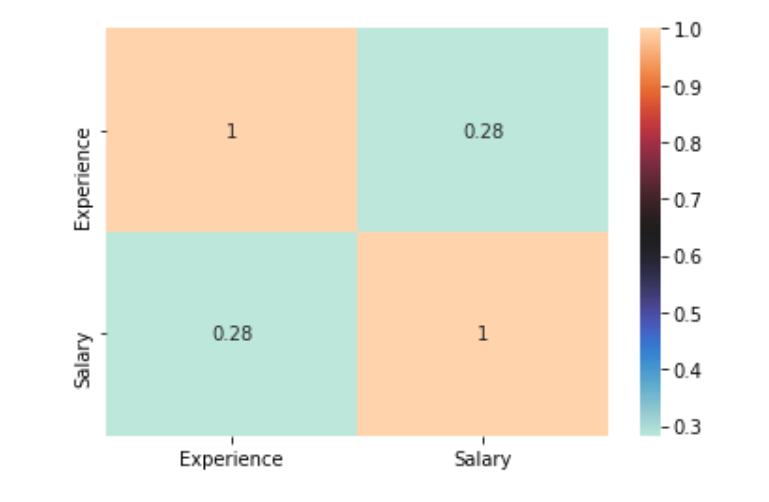
Calculating Correlation using Pandas Series Data
import pandas as pd
x = pd.Series(range(1,10))
y = pd.Series([8,3,9,2,6,1,7,4,34])

x.corr(y)   # O/P => 0.4633811275236339
# y.corr(x) # O/P => 0.4633811275236339

# x.corr(y,method='spearman')
Output => 0.09999999999999999

# x.corr(y,method='pearson')
Output => 0.4633811275236339
Correlation using Numpy
import numpy as np
x = np.arange(1,10)
y = np.array([8,3,9,2,6,1,7,4,34])
r = np.corrcoef(x,y)

print(r)
# r[0,1]
# r[1,0]

Output:  [[1.         0.46338113]
         [0.46338113 1.        ]]
Calculation of Correlation using SciPy
import numpy as np
import scipy.stats
x = np.arange(1,10)
y = np.array([8,3,9,2,6,1,7,4,34])

scipy.stats.pearsonr(x, y)
Output: (0.463381127523634, 0.20902620759881574)

scipy.stats.spearmanr(x, y)
Output: SpearmanrResult(correlation=0.09999999999999999, pvalue=0.797971695234851)
References:
- https://pandas.pydata.org/docs/reference/api/pandas.DataFrame.corr.html
- https://pandas.pydata.org/docs/reference/api/pandas.Series.corr.html
- https://seaborn.pydata.org/generated/seaborn.heatmap.html
- https://numpy.org/doc/stable/reference/generated/numpy.corrcoef.html
- https://docs.scipy.org/doc/scipy-0.14.0/reference/generated/scipy.stats.pearsonr.html
- https://docs.scipy.org/doc/scipy/reference/generated/scipy.stats.spearmanr.html
Learn more about Data Science articles in our upcoming Blog Articles.